Malvern Panalytical의 'ENHANCING THE PARTICLE SIZE ANALYSIS OF GRAPHITE POWDERS'에 관한 응용자료의 주요 내용은 다음과 같다.
Introduction
Global demand for graphite is soaring, with a 2020 World Bank Group report1 projecting that by 2050 annual demand will have increased by nearly 500% from 2018 production figures. This is being driven by the clean energy transition to electric cars and battery energy storage systems, as graphite is used to make lithium-ion battery anodes. The average 2020 car battery cell contains 52 kg of graphite(32.5% by weight of the total key mineral content).2 The properties that make it a great anode material, including its high thermal and electrical conductivity, also lends itself to many other innovative areas of research, such as specialist coatings and inks.
For a given application, the particle size and particle shape of the graphite powder normally needs to be tightly controlled. In a battery electrode, the size and shape of particles influences their packing behavior, which in turn effects the electrode’s energy density.3 As a well-established ISO-governed technique4 with fast analysis times and a wide dynamic range, laser diffraction is routinely used to monitor powder quality through particle size analysis. Combining laser diffraction with dynamic image analysis, where particles continually flow past a camera, provides an opportunity to also capture particle images, allowing the determination of particle shape information and helping to troubleshoot unexpected results.5
This application note discusses how the Hydro Insight dynamic imaging accessory, sitting in-line with the Mastersizer 3000 laser diffraction system, provides real-time images and particle size and shape distributions to help understand how a dispersed graphite sample behaves, leading to method improvements.
Materials and Methods
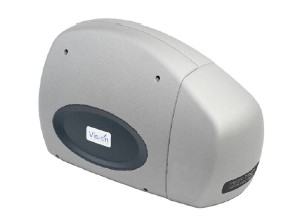
The Mastersizer 3000 with the Hydro EV dispersion unit is used to measure the particle size distribution of the graphite powder in deionised water, after first wetting the powder using a 5% solution of non-ionic surfactant. The Hydro EV has an ultrasonic processor built in, allowing the effect of ultrasound on the dispersion state to be investigated as part of the measurement. In-line with the optical bench and dispersion unit is the Hydro Insight imaging accessory(Figure 1) fitted with the standard magnification lens, which has a 1 to 300 μm size range. The Hydro Insight captures particle images from the flowing stream of suspended particles, with thirty-one particle size and shape parameters calculated for each particle.
Figure 1. The Hydro Insight dynamic imaging accessory for the Mastersizer 3000.
Particle size distributions from the Hydro Insight are reported using the equivalent circular area(ECA) diameter both as number-weighted, the primary output of image analysis, and as volume-weighted, to allow a more direct comparison with laser diffraction results. Fine material is much more obvious in the number-weighted distribution, while the volume-weighted distribution emphasizes any oversize material.
Results and Discussion
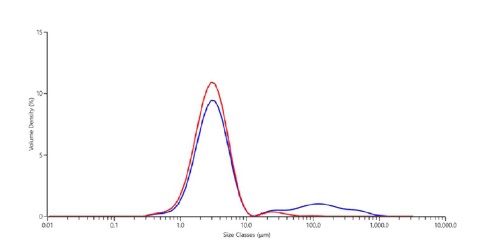
Figure 2 shows the particle size distribution of a graphite powder measured wet on the Mastersizer 3000 before and after the application of two minutes of ultrasound. The main population of particles is below 12 μm in size, with a mode at 3.1μm.
There is also an unexpected peak of oversize material stretching from approximately 15 to 800 μm in size. Upon applying ultrasound, the larger peak is significantly reduced and becomes more stable, but it does not disappear completely. The main mode remains at 3.1μm.
Figure 2. Overlay of the particle size distributions of the graphite powder measured wet on the Mastersizer 3000 before(blue line) and after(red line) the application of two minutes of ultrasound.
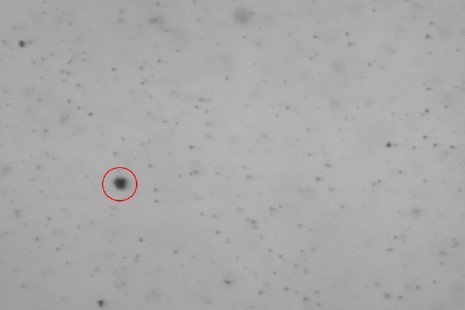
To confirm the presence of particles greater than 10 μm in size, the same graphite dispersion can be measured simultaneously with the Hydro Insight imaging accessory. Immediate visual assessment of the particles and dispersion is possible with the image feed(Figure 3), and particle thumbnails can be viewed once the measurement is complete.
Figure 3. Example graphite particle dispersion image from the Hydro Insight showing the presence of an oversize particle.
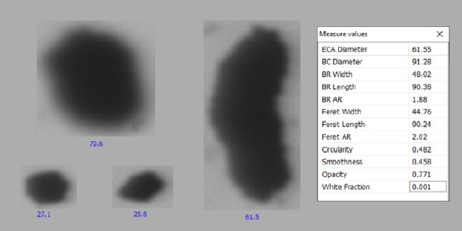
The Hydro Insight confirms that there are a low number of larger particles present in the sample both before and after the application of ultrasound. The thumbnail images show that before ultrasound(Figure 4) some agglomeration is present, explaining the presence of the peak of larger material in the particle size distribution measured by laser diffraction. These particles typically have lower circularity and smoothness values.
Figure 4. Example particle thumbnails for the graphite sample before ultrasound. Every thumbnail has a list of measured parameter values associated with it.
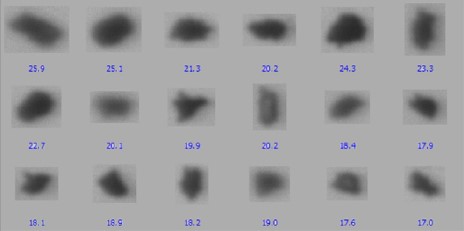
After the application of two minutes of ultrasound particles above 20 μm were still imaged(Figure 5), corresponding to the second mode at 24.1 μm in the laser diffraction result. The particle thumbnails now show mostly individual particles, which are typically elongated in shape.
Figure 5: Example particle thumbnails for the graphite sample after ultrasound. The value under each thumbnail is the ECA diameter in μm.
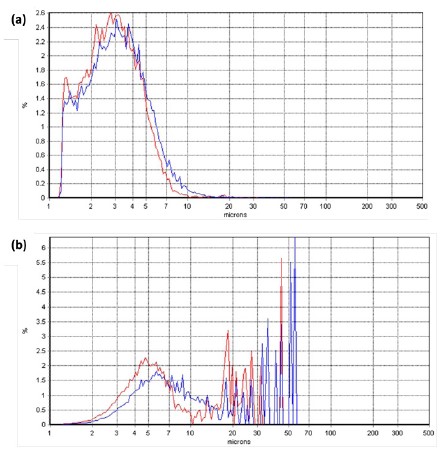
Overlays of the ECA diameter distributions for the graphite sample before and after ultrasound obtained on the Hydro Insight(Figure 6) show the effect of the ultrasound on the distribution, with a shift towards smaller particle sizes. The spikiness observed in the volume-weighted ECA diameter distributions indicates that while the number of oversize particles is low, these particles have a much larger volume when compared to the main particle population. The Hydro Insight results aid justification for the use of ultrasound to fully disperse this graphite sample in water.
Figure 6: Overlay of the (a) number-weighted and (b) volume-weighted ECA diameter for the graphite sample before(blue line) and after (red line) the application of two minutes of ultrasound. Due to the different dynamic ranges of the techniques the main mode is shifted slightly towards larger particle sizes when compared to the laser diffraction results.
Conclusion
Here, we demonstrate that visualizing the dispersion using the Hydro Insight dynamic imaging accessory alongside the laser diffraction results increases confidence in making measurement improvements, in this case confirming the need for ultrasound. The combination of two orthogonal techniques to simultaneously measure the same sample finds use in a variety of applications, from optimising dispersion conditions to troubleshooting.
Malvern Panalytical의 'Mastersizer 3000'에 대한 궁금한 내용은 본 원고자료를 제공한 말번 파날리티칼 코리아를 통하여 확인할 수 있다.
Reference(참고자료): 말번 파날리티칼 응용노트
1. https://www.worldbank.org/en/topic/extractiveindustries/brief/climate-smart-mining-minerals-for-climate-action
2. https://www.transportenvironment.org/discover/batteries-vs-oil-comparison-raw-material-needs/
3. Analytical toolkit for the optimization of battery electrode materials, Malvern Panalytical Whitepaper
4. ISO 13320:2020, Particle size analysis – Laser diffraction methods, 2020. Available at https://www.iso.org/standard/69111.html
5. Five compelling reasons to add the Hydro Insight dynamic imaging accessory to your Mastersizer 3000, Malvern Panalytical Whitepaper
Model Name(모델명): Mastersizer 3000
The Person in Charge(담당자): Kim Seungji
Maker(제조사): Malvern Panalytical
Country of Origin(원산지): UK
Mail inquiry: korea.info@malvernpanalytical.com
Data Services(자료제공): Malvern Panalytical Korea
<이 기사는 사이언스21 매거진 2023년 05월호에 게재 되었습니다.>


