Malvern Panalytical의 'CHARACTERIZING THE SIZE AND CONCENTRATION OF LIPOSOMES USING MULTI-ANGLE DYNAMIC LIGHT SCATTERING'에 관한 응용자료의 주요 내용은 다음과 같다.
Introduction
Liposomes are nowadays frequently used as drug delivery systems, and as such requires that they are well characterized for manufacturing and batch release. This characterization includes their size and size distribution. For these parameters, dynamic light scattering(DLS) is commonly used to characterize size and size distribution and also nanoparticle tracking analysis (NTA) has previously been shown to be useful for measuring liposomes size and concentration1. This application note will demonstrate how the multi-angle DLS(MADLS®) based particle concentration measurement in the Zetasizer Ultra is capable of measuring the particle concentration as well as size and size distribution of a range of dilutions of a liposome sample. A comparison will be made with NTA measurements of the same samples.
Experimental
The liposomes used were Formumax HSPC/CHOL liposomes (Cat No.: F0104, Batch No.: 08081701) and were diluted using Gibco PBS at pH 7.2(Cat No.: 20012019, Lot No: 1880350) using gravimetric dilution protocol. A Zetasizer Ultra and NanoSight NS300 were used to measure the liposomes at 25°C. The samples were measured 5 times on the Zetasizer Ultra using the particle concentration measurement. Using the NanoSight NS300, 5 videos of 60 seconds each were recorded while using the syringe pump and a 405nm laser.
Nominal dilutions from stock concentration down to a 1:1,000,000 dilution were measured on the Zetasizer Ultra. The 1:10,000,000 dilution was not measured as there was not enough signal at side scatter detector for the instrument to be able to accurately measure the size and therefore the concentration. The NanoSight NS300 was used to measure the dilutions from 1:10,000 to 1:10,000,000. Above 1:10,000 the samples were too concentrated for the NS300 instrument.
Results
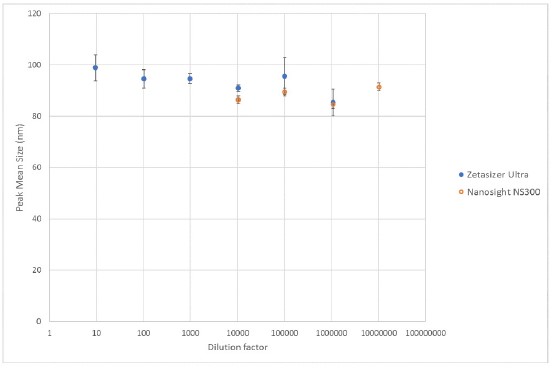
The size results across the dilution range measured by NTA and MADLS respectively, show a consistent mean size value of around 90nm. From 1:10 to 1:1,000,000 dilution, the mean size value is not changing significantly, see Figure 1.
Figure 1. Mean size results of liposomes from measurements on a Zetasizer Ultra and Nanosight NS300. For the Zetasizer Ultra the plotted values are the mean of the Z-Averages.
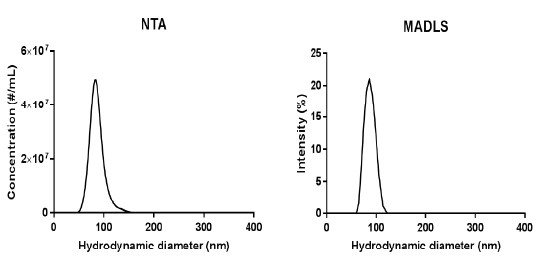
The size distributions for the 1:10,000 dilution measured in with MADLS and NTA are shown in Figure 2. As can be seen, NTA is able to pick up on a small shoulder of liposomes that are slightly larger than the main population, whereas these are too few and too close in size to be detected with MADLS.
Figure 2. Size distributions of 1:10,000 dilution of liposome sample from measurements on a NanoSight NS300 and a Zetasizer Ultra.
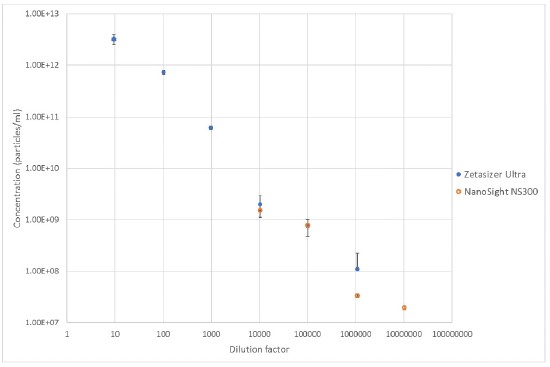
The mean concentration results from each instrument are shown below, Figure 3, which shows good agreement between the two techniques for the 10,000x and 100,000x dilutions where both these two techniques are measuring in a suitable concentration range. However, at the 1,000,000x dilution, there is less agreement between the two techniques with the Zetasizer measuring about twice as many particles as the Nanosight instrument. At this concentration the scattering intensity is very low in the Zetasizer, meaning there is low signal for the Zetasizer to correlate, especially in side scatter. Therefore, the result can be expected to be less accurate than at the higher concentrations.
Overall, the MADLS measurements of concentration show good linearity as the sample is diluted, and, in the concentration range where it overlaps with NTA, they show good correlation. The MADLS based particle concentration measurement is however able to measure the size and particle concentration values at much higher concentrations than NTA, whereas NTA can go lower in concentration than the MADLS based concentration measurement as shown in Figure 3.
Figure 3. Concentration results from measurements of liposomes on a Zetasizer Ultra and Nanosight NS300.
Conclusion
The Zetasizer Ultra’s MADLS based concentration measurement has been demonstrated to be able to measure both the size and concentration of liposomes with good agreement with NTA in the range where they overlap. The Zetasizer Ultra shows a wider concentration range at which it can measure the sample, however, the NTA can measure to a lower concentration. NTA is also able to detect a small shoulder of larger liposomes, which the MADLS measurement is unable to detect. The two techniques complement each other well, with MADLS providing a quick size and concentration measure for a wide range of concentrations, therefore requiring minimal sample prep, and NTA being able to go lower in sample concentration and provide more detail on the size distribution.
Malvern Panalytical의 'NanoSight NS300, Zetasizer Ultra'에 대한 궁금한 내용은 본 원고자료를 제공한 말번 파날리티칼 코리아를 통하여 확인할 수 있다.
Reference(참고자료): 말번 파날리티칼 응용노트
Model Name(모델명): NanoSight NS300, Zetasizer Ultra
The Person in Charge(담당자): Kim Seungji
Maker(제조사): Malvern Panalytical
Country of Origin(원산지): UK
Mail inquiry: korea.info@malvernpanalytical.com
Data Services(자료제공): Malvern Panalytical Korea
<이 기사는 사이언스21 매거진 2023년 4월호에 게재 되었습니다.>


