Malvern Panalytical의 'MEASURING THE SIZE OF FLUORESCENT QUANTUM DOTS USING ZETASIZER ADVANCE'에 관한 응용자료의 주요 내용은 다음과 같다.
Quantum dots are semiconductor nanoparticles that are also capable of emitting light. Past research has shown their potential in a range of applications such as solar panels and improvements to light emitting diodes(LEDs) and are now even appearing in commercially available products such as quantum dot LED television displays.[1]
Critical to the effectiveness of quantum dots in their applications is their size. By synthesizing quantum dots at different sizes, they will have different optical properties meaning they emit different colours of light as fluorescence. This infers that for the particles to be useful in displays their size must be tightly controlled and well known.[2]
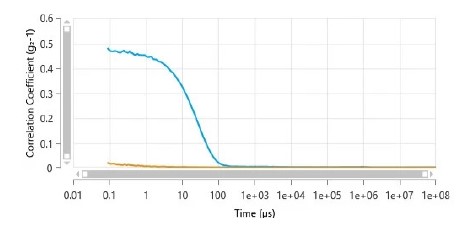
Dynamic Light Scattering(DLS) appears to be well suited to measuring the particle size of quantum dots as a quick and easy method. However, the fluorescence which is the key property of a quantum dots for their usefulness can also be detrimental to a DLS measurement. Quantum dots emit light when they are excited by another energy source which can include the laser light source found in all DLS systems. So, if the quantum dots are excited by the wavelength of the laser being used for the DLS measurement then they emit photons which will be detected as noise because they can’t be correlated in the measurement. This can significantly reduce signal to noise and hence the quality of the result, potentially affecting the size values reported. Below in Figure 1 is an example of a measurement with a good signal to noise ratio(blue) compared to one with a poor ratio(orange).
Figure 1. Correlograms with good(blue) and poor(orange) signal to noise ratios.
A way to eliminate or significantly reduce this issue is to fit the DLS instrument with a narrow band filter which restricts what wavelengths of light are able to reach the detector to only those close to the laser wavelength. However, this can often require the instrument to be opened for it to be fitted and if permanently fitted, as well as increasing the performance for fluorescent samples, it will decrease the overall signal that reaches the detector and therefore the performance of the instrument for all other sample types.
The Zetasizer Advanced series of instruments have a filter wheel which includes a fluorescence filter which can be simply selected by the user to be used as part of a measurement or not. This enables measurements of fluorescent samples to be run with a fluorescent filter but without impacting on the instrument’s overall performance. In this application note we will demonstrate how effective this can be.
Method
Two Invitrogen quantum dots samples, Qdot 655 ITK and Qdot 705 ITK, were diluted using a borate buffer at pH9. Qdot 655 was diluted to 1nM and Qdot 705 was diluted to 40nM. Each one was then measured at backscatter using a Zetasizer Ultra Red both with and without the fluorescence filter.
Results
For both samples, the number in the name refers to the wavelength it fluoresces at so Qdot 705 will fluoresce at 705nm and Qdot 655 will fluoresce at 655nm. This means that both fluoresce at a red wavelength, like the laser, but Qdot 655 fluoresces very closely to the wavelength of the laser.
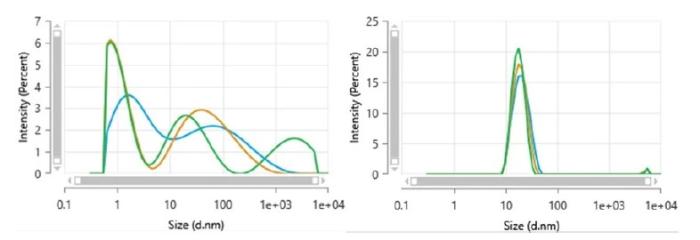
The first sample measured was Qdot 705 and below we can see the size distributions for the sample without the fluorescent filter(left) and with the fluorescent filter.
Figure 2. Size distributions of Qdot 705 without the fluorescence filter(left) and with the fluorescence filter.(right)
Immediately it is clear how much more consistent the data is with the filter in place with a well resolved peak being measured at about 20nm. Whereas without the filter this peak is broad with inconsistent positioning across the three repeats and there are also additional peaks being shown. The reason for these additional peaks and lack of consistency can be seen in the correlograms for the two sets of data as shown in Figure 2.
Figure 3. Correlograms of Qdot 705 without the fluorescence filter(left) and with the fluorescence filter(right), note the difference in Y-Axis values here.
The correlogram for Qdot 705 without the fluorescent filter has a much lower intercept value indicating there is a large amount of noise compared to the correlogram with the filter. It is this noise that is causing the additional peaks in the size distribution and the poor consistency between peaks.
Qdot 655 was likely to be a more challenging sample to measure well due to the fluorescence being so close to that of the laser wavelength. But, as we can see from Figure 3 there is a clear difference between the results with and without the fluorescence filter.
Figure 4. Size distributions of Qdot 655 without the fluorescence filter(left) and with the fluorescence filter.(right)
As with Qdot 705, the size distributions are much more consistent with the filter and show the sample to be monomodal. The peak measured with the fluorescence filter is broader than that measured for 705 and this may be due to a correlogram, that is improved compared to without the filter, but still showing noise compared to the Qdot 705 sample as shown in Figure 4.
Figure 5. Correlograms of Qdot 655 without the fluorescence filter(left) and with the fluorescence filter.(right)
Summary
Quantum dots are used both in research and commercially and a key parameter for them is their size. While DLS is well suited to measuring the size the ability of quantum dots to fluoresce is also a hinderance to a DLS measurement. We have shown here however that using the Zetasizer Advance and its fluorescence filter can significantly reduce the impact of this to provide high quality results, is easily switched into the detection path when the user wishes to determine if fluorescence is causing a poor signal to noise issue with their data and is easily switched out of the detector path to return the Zetasizer Advance system to its full sensitivity. The optical filter wheel is a feature of both our Zetasizer Pro and Ultra models.
Malvern Panalytical의 'Zetasizer Advance'에 대한 상세한 내용은 Reference(참고자료)를 통하여 확인할 수 있다.
Reference(참고자료):
[1]: Quantum Dots and Their Applications: What Lies Ahead?, Monica A. Cotta, ACS Appl. Nano Mater. 2020, 3, 6, 4920–4924
[2]: Analysis of Particle Size Distributions of Quantum Dots: From Theory to Application, D. Segets, KONA Powder Part. J.,2016, 33, 48-62
Model Name(모델명): Zetasizer Advance
The Person in Charge(담당자): Kim Seungji
Maker(제조사): Malvern Panalytical
Country of Origin(원산지): UK
Mail inquiry: korea.info@malvernpanalytical.com
Data Services(자료제공): Malvern Panalytical Korea
<이 기사는 사이언스21 매거진 2023년 2월호에 게재 되었습니다.>


