Malvern Panalytical의 'Characterization of electrocatalysts used in PEM electrolyzers and fuel cells'에 관한 응용자료의 주요 내용은 다음과 같다.
Introduction
As the energy sector and transport industry seek to mitigate their environmental impact, green hydrogen will likely play a major role in achieving carbon neutrality. Green hydrogen is produced by the electrolysis of water using renewable energy sources, such as solar or wind power. Electrolyzers based on polymer electrolyte membrane(PEM) technology provide an efficient pathway for producing green hydrogen through water electrolysis. By inverting the process, PEM fuel cells(PEMFCs) can be used to generate electricity using hydrogen as fuel, in combination with oxygen(which acts as an oxidizing agent). Fuel cells have the potential to make hydrogen a viable replacement for fossil fuels in energy, transport, and other industrial sectors. However, to achieve this on a large scale, their performance and cost must be optimized.
The catalytic material used to produce PEMFC electrodes is the main component in determining both the performance and the cost of fuel cells. The catalytic ink is typically composed of a mixture of a catalytic active material, an ionomer, and a dispersion solvent. Within the ink, the catalyst usually platinum-on-carbon(Pt/C) is a composite of platinum(Pt)-metal group nanoparticles deposited on activated carbon, which serves as a support matrix.
The catalyst’s activity and stability are the two key parameters that determine the PEMFC’s ultimate performance. Catalytic activity, in turn, is governed by the size, dispersion, and morphology of the Pt-metal group nanoparticles. Equally important are the structural, textural, and surface chemistry properties of the carbonaceous agglomerates during ink drying, upon deposition on the proton exchange membrane. The optimized pore structure of the C-support matrix can significantly reduce the amount of Pt needed, and the optimization of its distribution and maximization of the availability of the catalytic points for the oxygen reduction reaction (ORR) and hydrogen-oxidation reaction(HOR) in fuel cells reduces the overall cost of the process.
Catalytic activity and stability can be optimized in several ways: by developing novel Pt-alloy cathode materials, controlling the particle size for maximum mass activity, controlling the inter-crystallite distance, or ensuring uniform dispersion of Pt nanoparticles on the carbonaceous support.
Materials and Methods
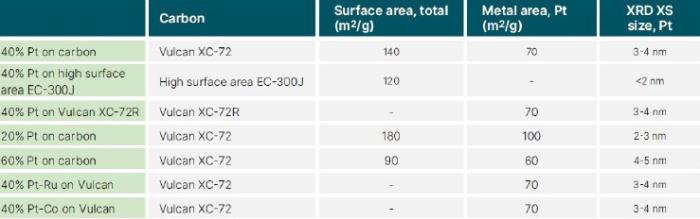
In this study, several techniques were used to analyze a set of catalyst powders made of Vulcan XC-72 carbon black, with three different Pt loadings: 60%(60m2/g), 40%(70m2/g), and 20%(100m2/g). These catalytic powders were bought from Premetek, with the following specifications:
X-ray diffraction(XRD), X-ray fluorescence(XRF) spectroscopy, and laser diffraction were shown to be highly effective in analyzing the catalytic powders. Techniques such as morphological imaging and dynamic light scattering, although highly useful in analyzing other aspects of catalytic inks, had limited application to the study of catalytic powders materials. Some Pt-alloy catalysts were also analyzed to see if the same techniques could also be applied to these materials.
Characterizing Pt/C catalysts can be difficult because its constituents span different size ranges:
• 2-5nm nanoparticles(Pt-metal group catalyst)
• 20-40nm primary particles(C-support)
• 100-300nm aggregates(C-support particles)
• 1,000-10,000nm(i.e., 1-10μm) agglomerates(Pt/C particles)
Furthermore, because the Pt particles are deposited on the C-support particles, they are difficult to size separately using large sampling statistic methods such as laser scattering.
Characterization of “Pt on Carbon”Catalyst Powders
X-ray Diffraction Analysis
X-ray diffraction of Pt/C catalysts primarily provides information on the Pt-metal group nanocatalyst. Data can be collected using either a benchtop or a floor-standing diffractometer, configured with the conventional Bragg-Brentano powder diffraction geometry.
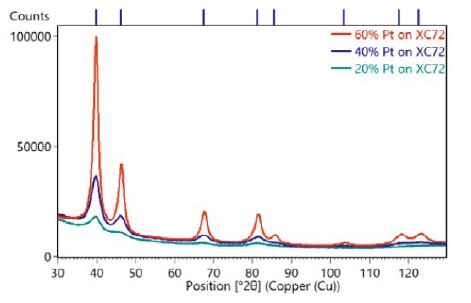
Figure 1 compares the diffraction patterns of the three samples with different Pt loadings on Vulcan XC-72 carbon black. These data points were collected using a 600W Aeris compact diffractometer, equipped with a Cu-anode X-ray tube, 1/4° divergence slit, and the PIXcel3D hybrid pixel detector. Small amounts of powder were prepared on zero background holders, using the dusting method.
The X-ray diffraction patterns provide information about the size of coherently scattering domains(derived from the diffraction peak widths) and lattice parameters(derived from the diffraction peak positions).
Three different techniques in the HighScore Plus software package were used to calculate the average coherently scattering domain(known as “crystallite”) size of the Pt nanoparticles: Scherrer, Williamson-Hall, and whole patternfitting(in this case, using the Pawley method). The Scherrer method estimates crystallite size using the width of a single diffraction peak in this case, the(111) peak at ~39.8° 2θ.
The Williamson-Hall method estimates the volume average crystallite size by evaluating how the width of multiple peaks varies in relation to the Bragg angle. This method not only separates the contributions of crystallite size and microstrain to the peak width, but it also provides a better estimate of the precision by using linear regression statistics. Finally, the whole pattern-fitting methods model the entire diffraction pattern, including peak width and unit cell lattice parameters.
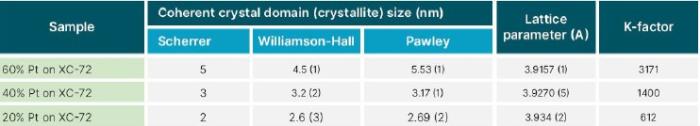
The results of all three methods are shown in Table 1. All three produced consistent results, showing that the average crystallite size continuously increases with Pt loading, within a range of 2–5nm. This comparison indicates that any of the three methods could be used to evaluate the coherent domain size of the Pt nanocatalyst in these samples. Each has its advantages and disadvantages, namely:
•The Scherrer method is quick and easy because it only requires the measurement of a single diffraction peak. In fact, with modern position-sensitive detectors, which observe >3° 2θ simultaneously, data for Scherrer analysis could be collected with a stationary detector for very fast monitoring in a production environment. However, the Scherrer method is not as precise as other methods that use multiple peaks.
•The Pawley whole pattern-fitting method has the advantage of determining lattice parameters and K-factor in addition to the crystallite size. As shown in Table II, there was a slight variation in the lattice parameters of Pt in the three different catalytic powders. This is consistent with previous findings, showing that lattice parameters may vary with crystallite size, though the precise relationship depends on the nanoparticle processing.
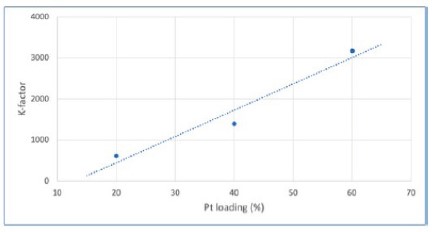
K-factor is a method of quantifying differences in the absolute diffraction pattern intensity, which is the most obvious difference between diffraction patterns observed in Figure 1. While most often used to quantify amorphous content in specimens, the K-factor with Pt loading is shown in a linear variation in Figure 2. However, a K-factor approach would be an imprecise way to monitor loading in a production environment, because it requires precise duplication of the sample preparation. If XRD data must be collected for other reasons— for example, to monitor crystallite sizes – then the data could also be used to semi-quantitatively monitor Pt loading at no additional expense. However, if the Pt loading itself is a critical factor to monitor(and thus requires high precision), XRF is a better technique.
Figure 1. X-ray powder diffraction data collected with an Aeris benchtop diffractometer from samples of Pt/C catalytic powder with three different Pt loading levels(20%, 40%, 60%) on Vulcan XC-72 carbon black support particles.
Figure 2. Variation of K-factor with Pt loading in Pt/C catalytic powders, which could be used for the approximate monitoring of Pt loading amount.
Table 2. Pt catalyst parameters calculated from the position, width, breadth, and intensity of X-ray diffraction peaks using HighScore Plus analysis software.
X-Ray Fluorescence Analysis
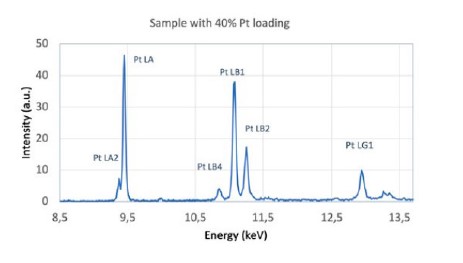
X-ray fluorescence(XRF) spectroscopy of Pt/C catalysts yields information about the elemental composition of Pt-metal group nanocatalyst. Data can be collected using either a benchtop or floor-standing spectrometer, based on either energy-dispersive or wavelength-dispersive methods. The XRF spectrum, example in Figure 3, immediately provides information about the Pt loading, composition of Pt-alloys, or purity of the catalyst.
Figure 3. XRF spectra showing elements present in a Pt/C catalyst obtained by measuring 40% Pt/C samples with an Epsilon 1.
Malvern Panalytical’s Omnian package provides a straightforward and simple method to measure the composition of Pt/C catalysts with XRF, using a standardless method. This solution doesn’t need in-type standards and is instead able to correct for differences in matrix and sample representation. This allows Omnian to be used for powder, solid, and liquid samples.
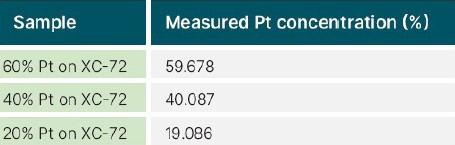
Table III shows the determined Pt loading for the three commercial Pt/C test samples. The samples were prepared as loose powder in a plastic cup, and an Epsilon 1 benchtop EDXRF spectrometer was used for the measurement. The evaluation shows the concentrations of the 60% and 40% Ptloaded powders are close to the listed specification, while the 20% Pt-loaded powder is slightly less than expected, which could mean that the catalyst is off-spec.
Table 3. Pt concentrations measured using an Epsilon 1 XRF spectrometer with Omnian standardless
For further improved quality control, as well as greater precision, users could opt to develop empirical calibration with in-type calibration standards. With calibration, the XRF spectrum can easily quantify the Pt loading with 0.1-0.3% precision. Additional method robustness can be obtained by using more precise sample preparation methods, such as pressed pellets or fused beads.
Laser diffraction
Laser diffraction gives insights into the particle size distribution of the carbon-support particles rather than the Pt catalysts. Laser diffraction is fast, non-destructive, and suitable for both laboratory and continuous in-line measurements. The wide measurement range of laser diffraction, from 10nm to 3500μm, is well suited to cover the coarse and fine agglomerates that maybe present in catalytic powders. While measurement of powder particles in a dry dispersion is possible, it is more common to measure them dispersed in a solvent such as isopropyl alcohol(IPA).
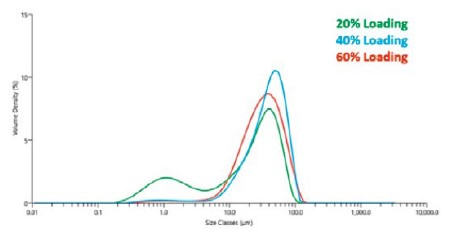
Figure 4 shows the particle size of Pt/C catalytic powders dispersed in IPA as determined using the Mastersizer 3000. Samples loaded with 60% and 40% Pt had similar size distributions. The powder containing 20% Pt was different, with a significant population of smaller agglomerates in the 1μm size range.
The laser diffraction data reveals the most potentially significant difference between the three catalytic powders with different Pt loading levels. The difference in the initial particle size of the C agglomerates could change the way the catalytic powder disperses in the ink, which is known to have a significant effect on the deposition process(and thus their performance). It is unlikely that differences in Pt loading would affect the particle size distribution of the C-support particles, suggesting that another process parameter may be changing during the production of the catalytic powders.
Figure 4. Particle size measured with a Mastersizer 3000 laser diffraction instrument from samples of Pt/C catalytic powder with three different Pt loading levels(20%, 40%, 60%) on Vulcan XC-72 carbon black support particles.
Morphological image analysis
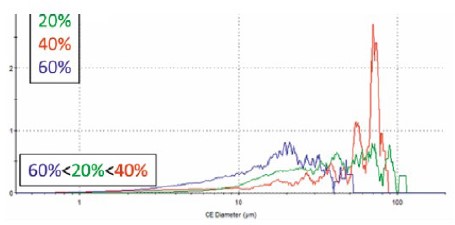
Automated morphological image analysis can also be used to analyze agglomerates of the C-support particles. Systems such as the Morphologi 4 image individual particles and produce a particle size distribution based on discrete particle counting. The resolution for Pt/C catalytic powders is limited because the agglomerate size is close to-but below the limit of-the size range of this technique, which is 1 to >1,000μm. Particle size determined with the Morphologi 4 may thus underrepresent the smaller agglomerates. As shown in Figure 5, the three Pt/C catalytic powders have similar particle size distributions when measured by the Morphologi 4 as obtained with laser diffraction. However, the small agglomerate population measured by laser diffraction for the 20% Pt-loaded powder is not represented in this analysis. Imaging techniques also suffer from inferior particle statistics compared to laser diffraction but provide additional information on the shape and other particle morphology parameters.
Figure 5. Particle size by volume as measured with a Morphologi 4 from samples of Pt/C catalytic powder with three different Pt loading levels(20%, 40%, 60%) on Vulcan XC-72 carbon black support particles.
Particle imaging with the Morphologi 4 is advantageous because images of individual agglomerates can be retrieved, compared, and evaluated on parameters such as circularity, convexity, and roughness. Figure 6 shows a snapshot of the particles imaged in the 40% Pt-loaded catalytic powder. In this case, the agglomerates are nearly spherical, and are not exhibiting any significant anisotropy to affect the ink processability. However, the roughness of the agglomerates could affect the ease of dispersion in the ink and the formation of porosity during deposition and drying.
위 본문의 나머지 내용은 사이언스21 7월호에 이어서 기재된다.
Malvern Panalytical의 'Mastersizer 3000, Epsilon 1, Morphologi 4 and Aeris'에 대한 궁금한 내용은 본 원고자료를 제공한 말번 파날리티칼 코리아를 통하여 확인할 수 있다.
Reference(참고문헌): 말번 파날리티칼 응용노트
Model Name(모델명): Mastersizer 3000, Epsilon 1, Morphologi 4 and Aeris
The Person in Charge(담당자): Hyunjung Gu
Maker(제조사): Malvern Panalytical
Country of Origin(원산지): UK, Netherlands
Mail inquiry: info.korea@malvern.com
Data Services(자료제공): Malvern Panalytical Korea
<이 기사는 사이언스21 매거진 2022년 6월호에 게재 되었습니다.>
|


 이전기사 :에너지 분산형 X선 형광분석기를 이용한 폴리에틸렌의 염소와 RoHS 분석
 다음기사 :단백질 안정성 분석